
CRO Handover · 21 October 2026 · 2 min read
Page 8: Which forecast numbers you can trust
A new CRO should check where each forecast number started before trusting it. Comparing the win rate of sales development pipeline with pipeline account executives generate themselves often measures when an opportunity was added, not how good it is. Page eight of the Handover File tests Systems and Data.
By Jeremy Heap, Founder, RepAgentic
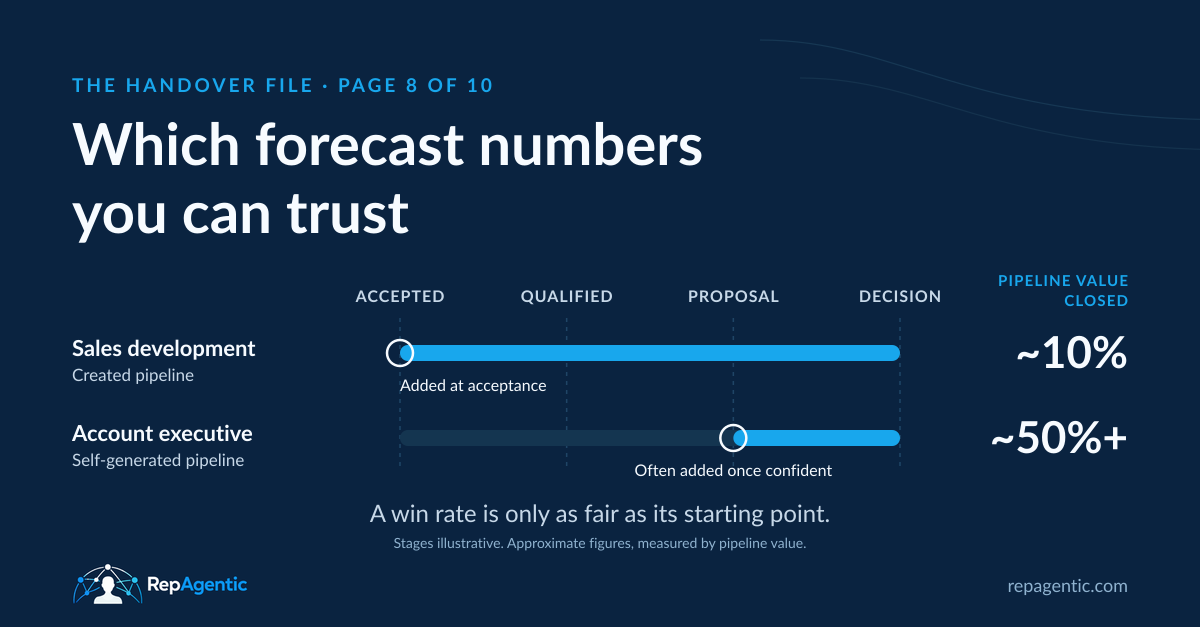
At a global enterprise software company where I led sales development, about 10% of the pipeline value the sales development team created closed. For pipeline account executives generated themselves, it was closer to 50%.
On paper, sales development looked five times weaker. That ratio is often used to judge sales development performance.
But the two numbers started at different points. Sales development opportunities entered the CRM when an account executive accepted them. Account executives often added their own only once they were confident they would close.
How should a new CRO compare pipeline by source?
Measure each source from the same stage. Take every opportunity that reached the same agreed stage and compare how much of that pipeline value closed, whoever created it.
Then ask when self-generated opportunities first appear in the CRM. If they arrive close to the decision, their win rate reflects the account executive's confidence, not the quality of the source.
The forecast carries the same distortion. Pipeline added late looks reliable because the uncertain part happened outside the system.
Trust the record, not the ratio
In RepAgentic's framework, Systems and Data covers whether the CRM records what actually happened accurately enough to make decisions on. Page six separated seller activity from buyer progress. This page checks whether the forecast compares like with like.
Don't judge sales development on a ratio that starts at different points. Compare stage to stage, then decide.
Next, page nine: which dashboard numbers deserve attention.
A win rate is only as fair as its starting point.
Where this starts
Is your forecast comparing like with like?
The free Outside-In Read examines your public go-to-market and identifies visible gaps and where to look first. It cannot see your CRM stage history, win rates by source or when opportunities were added. Those need internal evidence through Inside-Out Verification. Start with the free read, then decide what to examine next.